What is a Tableau Race Bar Chart?
A Tableau Race Bar Chart is a visualization tool that makes data more engaging by turning it into an animated race. It works by showing bars representing different categories moving and changing in size over time. This dynamic display helps viewers easily follow changes in rankings and trends. It’s like watching a competition unfold, making the data easier to grasp and remember.
A Tableau Race Bar Chart is often used when more dynamic visualizations are needed. It is a compelling way to display and compare the changing ranks of different categories over time based on their numerical values, like sales figures, population, or scores.
This type of chart turns traditional bar charts into a more fun and entertaining race, making it easier for viewers to understand trends, growth, and declines across various categories as they change over time. It’s particularly popular for storytelling with data, as it can highlight the progress and competition between entities in a visually engaging way.

Let’s Build a Tableau Race Bar Chart!
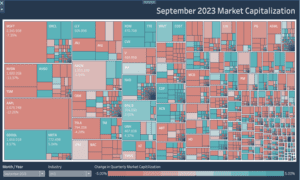
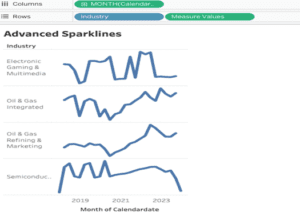
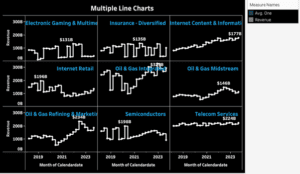
In this tutorial, we will build a Tableau Race Bar Chart that will focus on showing revenue across different industries over a four-year timeframe.
We will use the data to explore how revenue trends can vary from one industry to another and how these trends evolve year by year.
By the end of this quick tutorial and after successfully constructing your Tableau Race Bar Chart, you’ll be equipped with the expertise to delve into the intricate dynamics of industry revenue fluctuations.
You’ll be able to use this tool to gain a great understanding of market trends and industry performance metrics.
These insights will not only facilitate informed decision-making but also empower you to anticipate and adapt to changes in the competitive landscape and position yourself or your organization for sustained success in the ever-evolving marketplace.
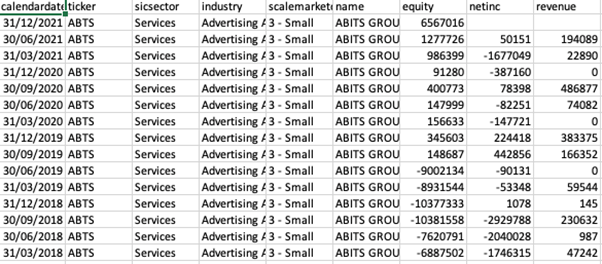
We will be using the following data for our chart:
Instructions
Step 1:
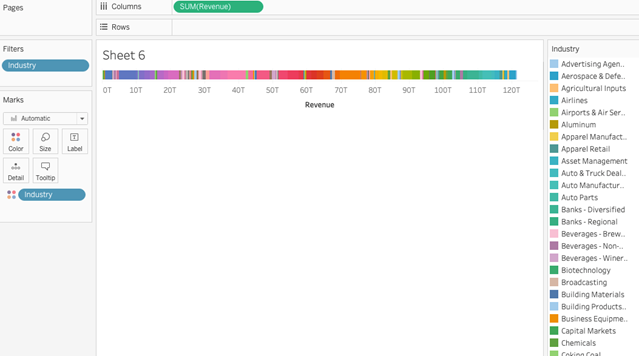
Drag the Revenue in columns and Industry in the colour mark.
Your view will now be somewhat like this:
Step 2 :
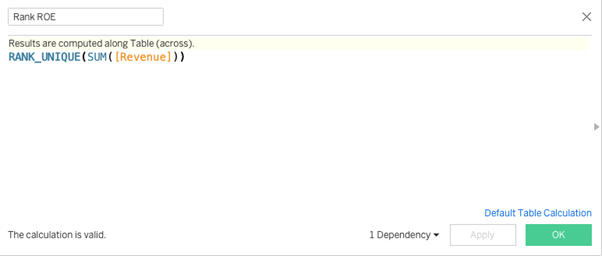
For step two, let us create a Rank calculation to calculate the rank based on the revenue of industries like the example down below:
Step 3:
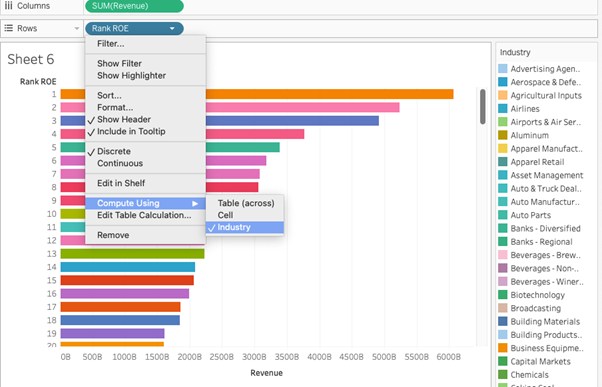
Now you can convert this calculated field to discrete and bring it on to rows.
Right-click on the Rank ROE field and compute it using industry.
Step 4:
Place the calendar date field and make it month on the page shelf and you will see a control to navigate the years like in the example pictured below:
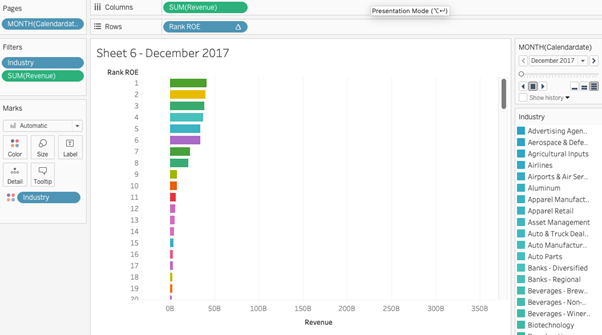
Now once you click on the play button you can see the race bar in actions and see how revenue has become higher with the industries in the years.
The last and final step is to format to your visual preferences and the final product should look like our fantastic Race Bar Chart below!
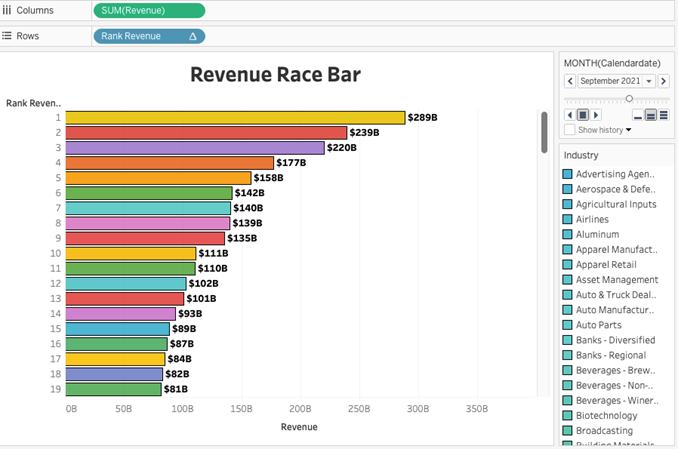
Congratulations! You’ve completed your Tableau Race Bar Chart!
Congratulations on mastering the Tableau Race Bar Chart and adding a valuable skill to your repertoire! By honing your Tableau expertise, you’re equipped to create even more dynamic and impactful visualizations in the future. Whether for clients or future job opportunities, your newfound skills will undoubtedly set you apart and enable you to deliver compelling insights with confidence and flair. Keep exploring and innovating!
For additional guidance on mastering Tableau and expanding your skill set, we encourage you to visit our blog. Dive deeper into Tableau techniques and stay updated on the latest developments. If you’re seeking professional Tableau consulting services to drive successful data projects across finance, marketing, and sales, explore our website and reach out via email for tailored assistance. We’re here to support your journey to Tableau excellence!