How To Make A Tableau Treemap
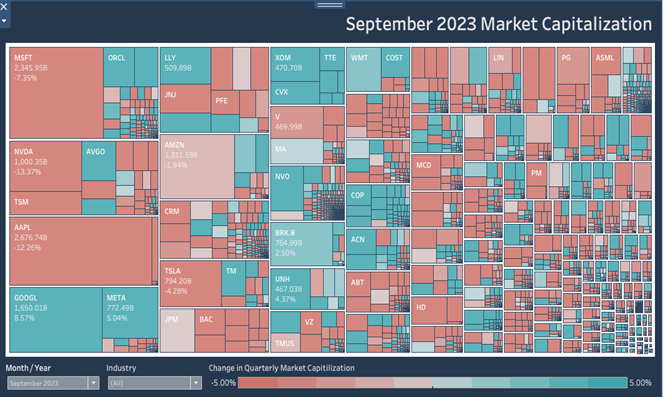
What Is A Tableau Treemap? A Tableau Treemap provides a powerful tool for visualizing hierarchical data in a nested format, where each branch of the

What Is A Tableau Treemap? A Tableau Treemap provides a powerful tool for visualizing hierarchical data in a nested format, where each branch of the

What is a Tableau Marimekko Chart? A Marimekko chart, also known as a Mekko chart or market map, is a type of visualization used primarily

What is a Tableau Curved Line Chart? A Tableau Curved Line Chart is a variation of standard line charts. They look more interesting but the

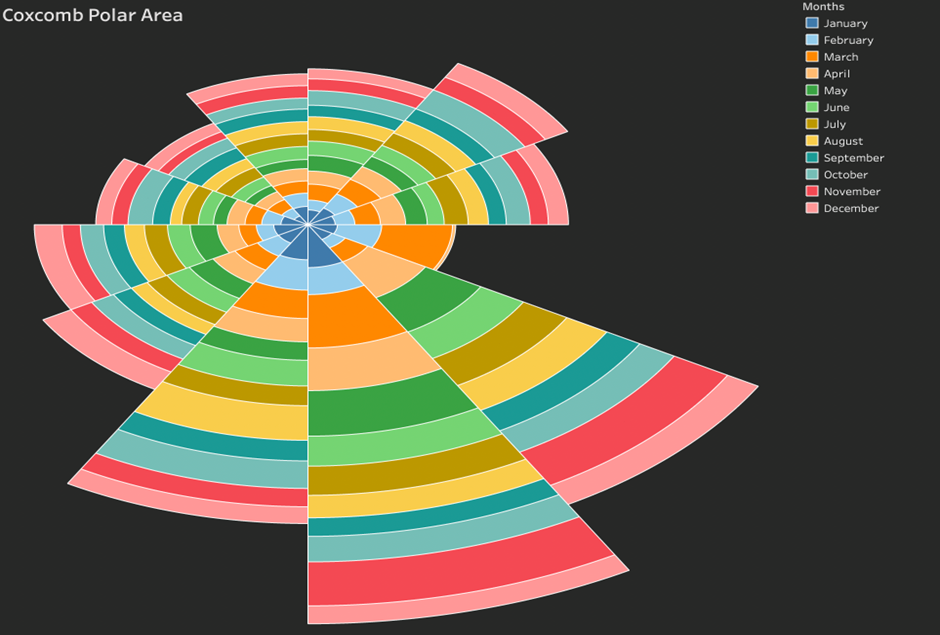
What is a Tableau Coxcomb Polar Area Chart? A Tableau Coxcomb Polar Area chart is a way of visually representing quantitative values across different dimensional

What is a Tableau Half Circle Timeline? A Tableau Half Circle timeline chart allows you to plot a measure along an axis using half circles

Welcome to our latest blog post, where we delve into the world of Tableau line charts, an essential tool in the arsenal of data visualization.

Data For Tableau Rounded Bar Chart Tutorial To follow along with this tutorial, download the data below What is a Tableau Rounded Bar Chart? Tableau

Data Set for Tableau Jitter Chart If you want to follow this tutorial, here is the dataset. What is a Tableau Jitter Chart? A Tableau

To learn Tableau as a beginner opens up a world of possibilities in data visualization and business intelligence. This comprehensive guide will walk you through

What is a Tableau Radial Times Series Chart? Most standard charts have a radial version that looks more trendy. In many cases, these fancy chart
Welcome to our Tableau Consulting Services. We specialize in helping businesses optimize their data analysis and decision-making capabilities using Tableau.
Expert Tableau Consulting Services and Solutions
Quantize Analytics Ltd. 11097872