A well-structured Tableau dashboard background offers an immediate advantage by providing a cohesive, ready-to-use layout that enhances storytelling and user experience. Instead of designing every element from scratch, teams can focus directly on data analysis and insight delivery, confident that the visual structure follows best practices. A professionally crafted Tableau dashboard background ensures consistent use of fonts, colours, margins, and sheet alignment, allowing for intuitive navigation and fast information processing. It minimises design time, promotes visual harmony, and helps maintain branding across multiple dashboards. With a reliable Tableau dashboard background in place, analysts, developers, and business users can focus their efforts on building impactful visualisations that drive better decision-making and strategic conversations from the beginning of the project.
Supercharge Your Data Storytelling with These Ready-to-Use Tableau Dashboard Templates – Part 1
Boost Your Dashboard Design with These 3 Powerful Dashboard Background Templates – Part 3
Table of Contents
How to Use Tableau Dashboard Templates
Getting started with a Tableau dashboard background is quick and easy.
You can replace the placeholder sheets with your content, including logos, titles, filters, KPIS, and worksheet visuals that fit the Tableau dashboard background.
You can customise the layout by adjusting colours, fonts, and content to match your brand. You can also maintain the original structure by aligning the outer and inner padding of your new sheets to match the placeholders.
These steps allow you to quickly build professional, on-brand dashboards using a Tableau dashboard background, saving time while maintaining design consistency.
#1 Tableau Dashboard Background – B1
This Tableau dashboard template provides a clean and highly organised structure for building professional dashboards with a strong Tableau dashboard background. On the left, a vertical navigation pane includes space for a company logo, dashboard title, and buttons for switching between multiple views (up to four, labelled View 1 Name to View 4 Name). This side menu offers a consistent way to navigate different sections of a larger dashboard project.
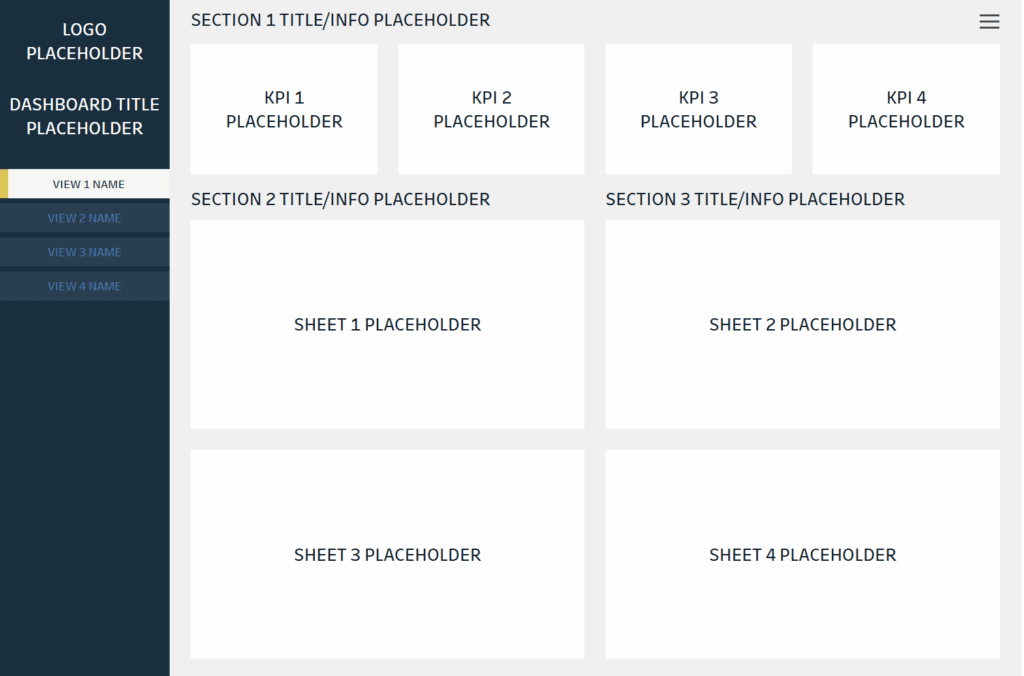
The main body of the template is divided into three significant sections. At the top, Section 1 contains placeholders for four KPIS (Key Performance Indicators), allowing users to highlight critical metrics against the Tableau dashboard background quickly. Below that, Section 2 and Section 3 offer space for detailed visualisations or data sheets, such as bar charts, trend analyses, or tables. Each Sheet Placeholder is sized equally for a balanced, professional appearance.
This template is handy for data analysts, business intelligence developers, consultants, and managers who need to present operational, financial, or sales data clearly and concisely. It suits industries like retail, finance, healthcare, or logistics — anywhere dashboards are needed to monitor key performance indicators (KPIS) and drive decisions. Its modular and navigable design makes it ideal for both executive overviews and deep analytical exploration within a Tableau dashboard background.
#2 Tableau Dashboard Background – B2
This Tableau dashboard background provides a simple yet highly functional layout designed for precise and compelling data presentation. On the left-hand side, a vertical navigation panel features placeholders for a logo, dashboard title, and multiple view selection buttons, allowing users to switch between different parts of a report or project easily. The navigation is clean and consistent, ensuring an intuitive user experience within the Tableau dashboard background.

The main dashboard area is divided into three sections. At the top, Section 1 contains a prominent placeholder for a primary sheet, ideal for displaying key trends, summary charts, or high-level analysis against the Tableau dashboard background. Below it, Section 2 and Section 3 are split horizontally, each with space for additional visualisations or detailed breakdowns of the primary data shown above. This structure supports a storytelling approach that allows users to explore data from a high-level overview to more detailed insights.
The Tableau dashboard background is beneficial for business analysts, data visualisation specialists, consultants, and managers who need a clean structure to present insights. It works well across industries such as finance, marketing, operations, and healthcare, where multiple views and detailed analysis are crucial. Its organised design ensures users can communicate complex data clearly and efficiently to decision-makers or clients.
#3 Tableau Dashboard Background – B3
This Tableau dashboard background presents a clear, well-organised layout designed for effective data communication. On the left-hand side, the dashboard includes a vertical navigation pane with placeholders for a logo, dashboard title, and buttons for switching between up to four different views. This setup allows users to move easily across various sections of their analysis while maintaining a consistent Tableau dashboard background.
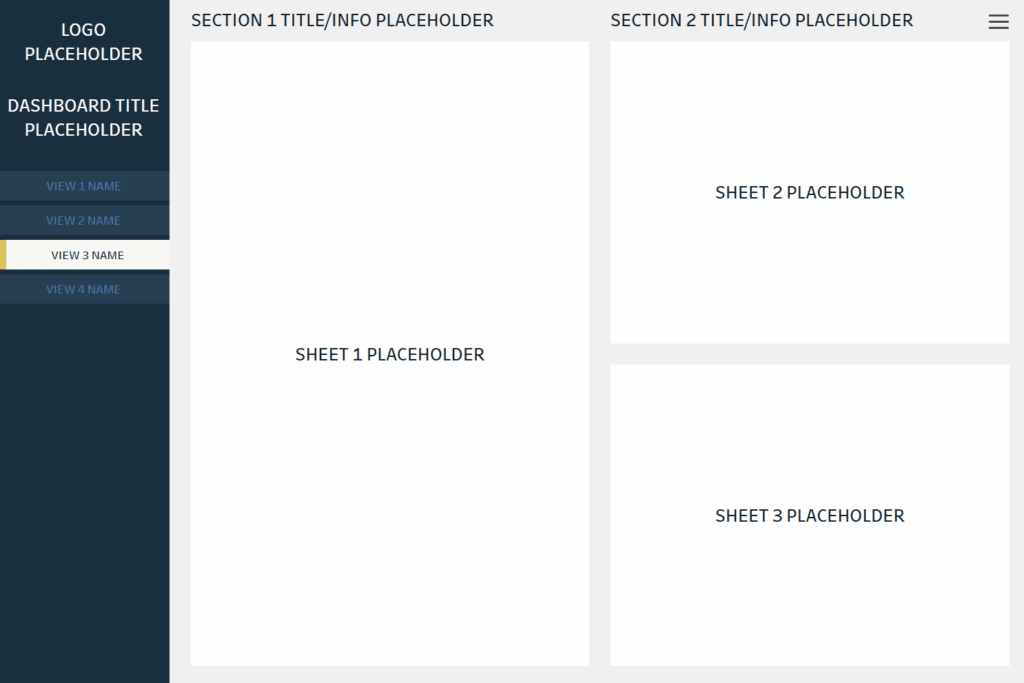
The main dashboard area is divided into two vertical columns. Section 1 on the left features a prominent placeholder for a primary sheet, ideal for highlighting major metrics, trends, or a key visualisation that needs the most attention within the Tableau dashboard background. On the right side, Section 2 contains two stacked placeholders for additional sheets, offering room for secondary charts, detailed breakdowns, or comparative insights. Each section includes a title and info placeholder, providing space for context or commentary about the visualisations.
This Tableau dashboard background is perfect for data analysts, business intelligence professionals, consultants, and decision-makers who need a clean, easy-to-navigate dashboard for presenting key information. It works well across various industries, such as finance, marketing, healthcare, and operations, where multiple layers of data need to be communicated. Its structured design ensures a logical flow from summary insights to detailed analysis.
#4 Tableau Dashboard Background – B4
This Tableau dashboard background features a clean and straightforward layout, ideal for clearly and efficiently displaying key data insights. On the left side, the template includes a vertical navigation bar with placeholders for a company logo, dashboard title, and buttons to switch between four different views. This consistent navigation system allows users to explore other sections of the dashboard easily while maintaining the overall Tableau dashboard background.
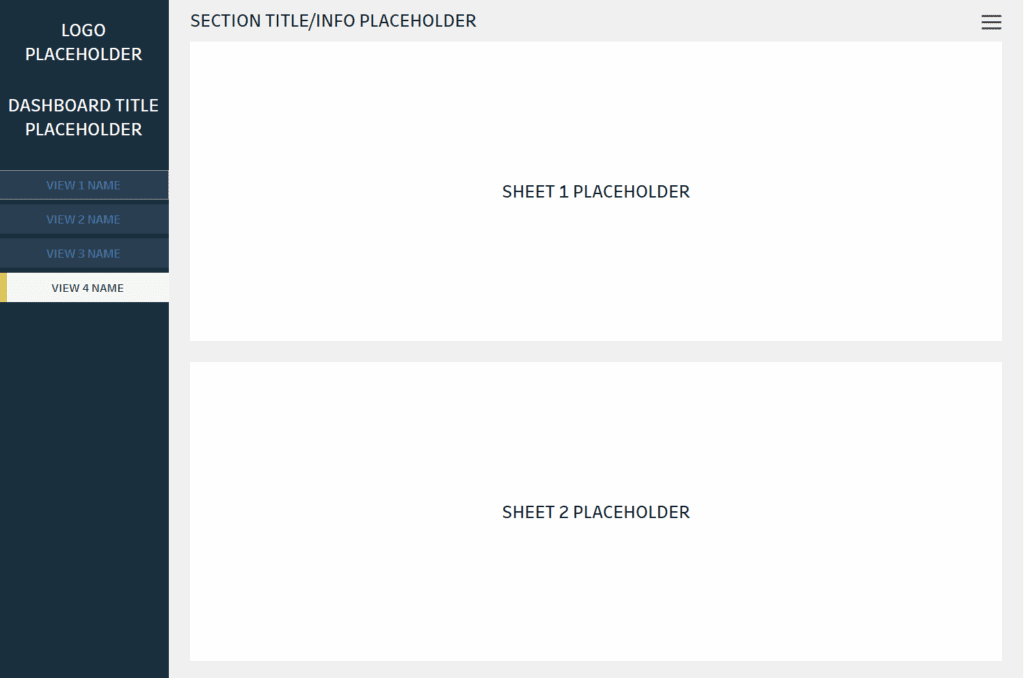
The main area of the dashboard is structured into two large sections. At the top, there is a wide placeholder labelled Sheet 1, perfect for showcasing a primary visualisation such as a summary chart, performance overview, or trend analysis. Directly below it, another equally large placeholder labelled Sheet 2 provides additional space for supporting visualisations, detailed breakdowns, or comparative data views. A section title and info area at the top provide space for users to add context or instructions for interpreting the dashboard content.
This Tableau dashboard background is beneficial for business analysts, executives, consultants, and team leads who need a simple yet powerful way to present and explain their data. It is suitable for industries such as finance, sales, operations, healthcare, and marketing, where quick access to clear and actionable insights is essential for informed decision-making.
Implementing a Tableau dashboard background at the start of a new project provides long-term value in terms of usability, design, and efficiency. It instantly elevates the look and feel of a dashboard, ensuring a clean, professional appearance that enhances data interpretation. A well-planned Tableau dashboard background creates visual consistency across charts, KPIS, filters, and text, offering a seamless flow that guides users through the story behind the data. It reduces the need for time-consuming layout adjustments, freeing teams to focus on uncovering insights and creating more relevant and impactful dashboards. For stakeholders, this translates to quicker understanding and improved decision-making. Whether for internal performance monitoring or client-facing reporting, a solid Tableau dashboard background reinforces brand consistency and builds trust. Starting with this foundation sets a higher design standard from the outset, enabling faster development, stronger engagement, and more confident communication throughout the project lifecycle.
Supercharge Your Data Storytelling with These Ready-to-Use Tableau Dashboard Templates – Part 1
Boost Your Dashboard Design with These 3 Powerful Dashboard Background Templates – Part 3