In the world of quantitative trading, one strategy has stood the test of time for its balance between simplicity and statistical rigor: pairs trading.
This strategy doesn’t require predicting market direction. Instead, it focuses on identifying relationships between two assets, exploiting temporary deviations in their relative value, and profiting when prices revert to their historical equilibrium.
Table of Contents
This article introduces the Pairs Trading Within Industries Dashboard — a powerful tool for identifying statistically significant pairs of stocks that move together over time.
We’ll explore the fundamentals of pairs trading, outline how to find pair trading stocks, break down what’s inside the dashboard, and explain who might benefit from using it.
1. A Quick Primer on Pairs Trading
Pairs trading is a market-neutral strategy that takes advantage of relative mispricing between two securities. The process generally involves:
- Finding a relationship
Identify two assets whose prices historically move together. This movement can be quantified using correlation (short-term similarity) and cointegration (long-term equilibrium relationship). - Monitoring the spread
Calculate the difference (or spread) between the two prices. In a cointegrated relationship, the spread should be stationary, meaning it oscillates around a constant mean. - Trading deviations
When the spread moves significantly above or below its historical average, it suggests one stock has moved too far relative to the other. Traders can:- Go long the undervalued stock.
- Go short the overvalued stock.
- Close the trade when the spread returns to the mean.
This approach works in both rising and falling markets, making it popular among hedge funds, market makers, and proprietary trading desks.
2. The Role of Stationarity in Finding Pairs
The key to a robust pairs trading strategy is stationarity. A stationary time series has statistical properties — mean, variance — that don’t change over time.
If the spread between two stocks is stationary:
- Price deviations tend to correct themselves.
- The long-term mean acts like a magnet, pulling the spread back after it drifts.
- This mean-reverting behavior creates repeatable trading opportunities.
Statistical tests like the Augmented Dickey-Fuller (ADF) test measure stationarity.
- A low p-value (e.g., < 0.05) means strong evidence of stationarity.
- A high p-value means the spread is likely non-stationary — the two prices may drift apart over time.
3. Why Focus Within Industries?
While you can search for pairs across the entire market, focusing within the same industry offers advantages:
- Shared economic drivers: Companies in the same industry often react similarly to market forces such as interest rates, commodity prices, and regulation.
- Higher probability of cointegration: Similar business models and revenue sources make stable relationships more likely.
- Risk reduction: Trading relative movements instead of absolute prices reduces exposure to broad market moves.
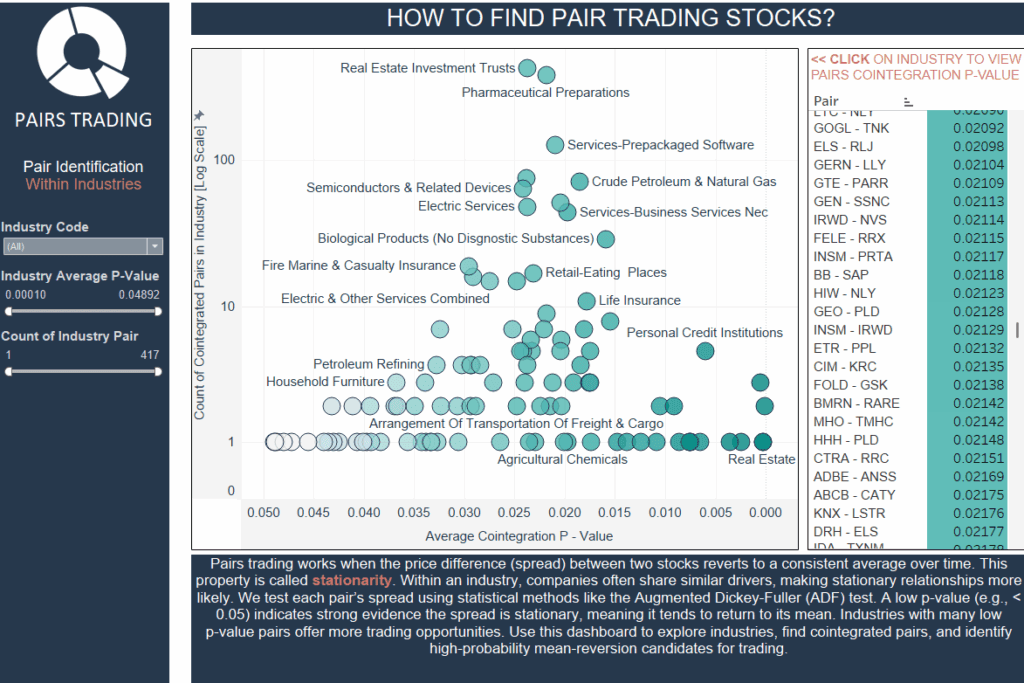
4. What the Dashboard Shows
The Pairs Trading Within Industries Dashboard is designed to help traders quickly identify promising pairs based on stationarity tests.
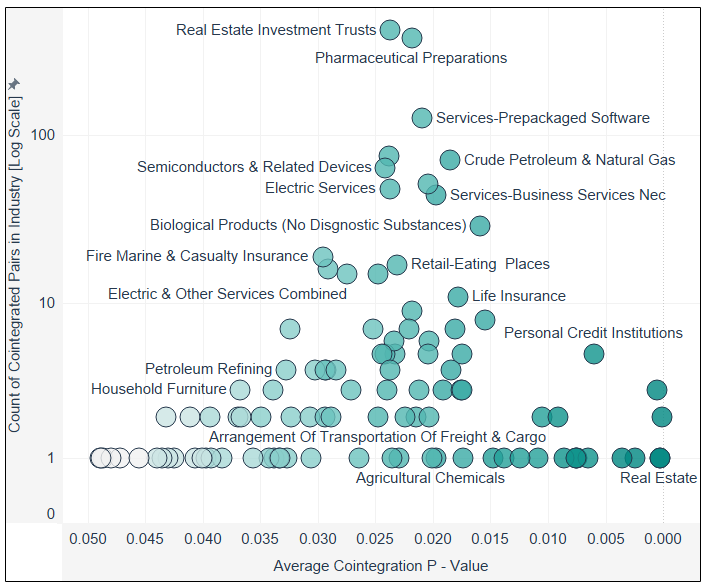
Main Scatter Plot
- X-axis: Average cointegration p-value for an industry. Lower values = stronger mean-reverting relationships.
- Y-axis: Count of cointegrated pairs in the industry (log scale). Higher counts = more opportunities.
- Circles: Each represents an industry. Size can reflect number of pairs.
- Labels: Industry names such as Real Estate Investment Trusts, Pharmaceutical Preparations, and Personal Credit Institutions.
Interactive Filters
- Industry Code dropdown: Narrow analysis to a specific sector.
- Sliders:
- Industry Average P-Value: Filter by cointegration strength.
- Count of Industry Pair: Show industries with specific ranges of cointegrated pairs.
Pairs Table (Right Panel)
- Clicking an industry lists the individual stock pairs and their cointegration p-values, sorted by statistical strength.
Explanatory Text (Bottom Panel)
- Summarises stationarity, how to interpret p-values, and why industries with many low-p-value pairs may be rich in opportunities.
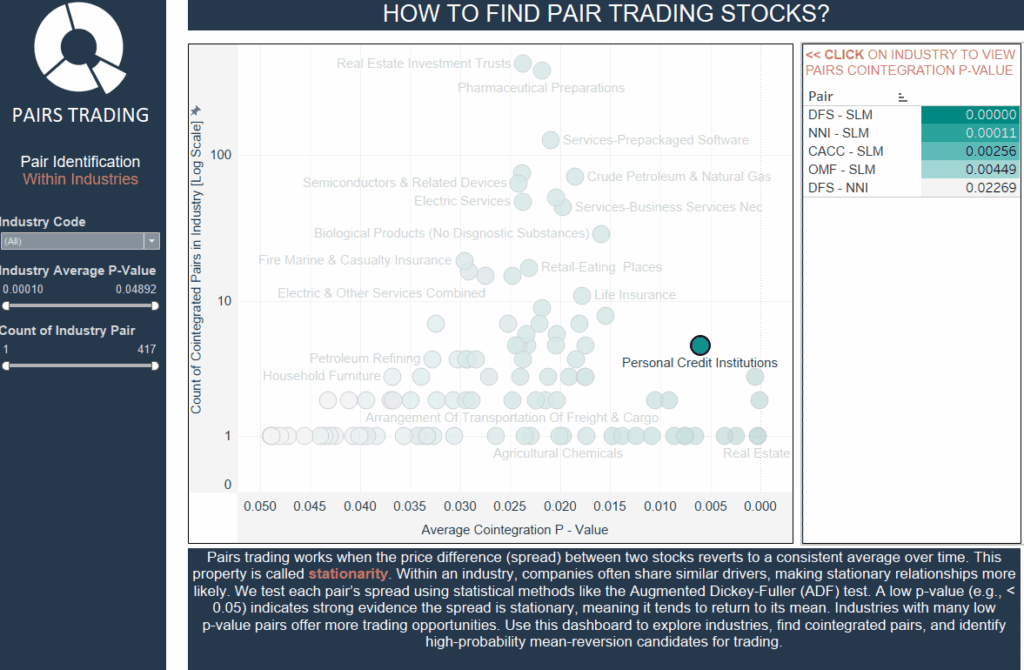
5. Example Insights from the Dashboard
From the dashboard:
- Personal Credit Institutions show extremely low p-values, indicating strong cointegration despite a moderate number of pairs.
- Clicking “Personal Credit Institutions” reveals pairs like
DFS – SLMandNNI – SLMwith near-zero p-values, suggesting high-probability mean reversion.
6. Who Might Use This Dashboard?
Quantitative Traders
- Identify statistically valid pairs quickly.
- Feed results into backtesting and execution systems.
Hedge Funds & Proprietary Trading Firms
- Source market-neutral opportunities.
- Build sector-specific stat-arb strategies.
Data Scientists & Analysts
- Research statistical relationships between stocks.
- Enhance forecasting models with cointegration insights.
Portfolio Managers
- Hedge sector risk with relative value trades.
- Spot merger or acquisition candidates.
Educators & Students
- Demonstrate real-world applications of stationarity and cointegration.
- Provide hands-on learning in quantitative methods.
7. Practical Tips for Using the Dashboard
- Start broad, then filter — View all industries, then focus on those with low average p-values and high pair counts.
- Prioritize statistical strength — p-values below 0.05 are a good starting point.
- Drill down — Click an industry to see pairs with low p-values, good liquidity, and stable spread histories.
- Validate trades — Always backtest before live trading.
8. Limitations and Considerations
- Relationships can break down — past cointegration doesn’t guarantee future stability.
- Market events — earnings, regulations, or news can disrupt relationships.
- Liquidity — illiquid stocks can increase slippage.
- Costs — frequent trades can be eroded by transaction costs.
9. Final Thoughts
The Pairs Trading Within Industries Dashboard makes learning how to find pair trading stocks straightforward by turning statistical testing into an intuitive, interactive process. Traders can quickly identify sectors rich in mean-reverting opportunities, drill down to the strongest candidates, and integrate them into a strategy.
By combining industry-level filtering, stationarity testing, and visual exploration, it shortens the path from research to execution — whether for a professional trading desk, a systematic strategy builder, or anyone mastering market-neutral investing.