A well-designed dashboard background is the foundation for effective data presentation, providing a consistent structure that enhances user experience and data visualisation. By optimising layout clarity, dashboard backgrounds enable users to identify key metrics, trends, and actionable insights quickly. This blog presents three impactful dashboard background examples that illustrate how strategic design can elevate data storytelling and improve overall functionality.
Supercharge Your Data Storytelling with These Ready-to-Use Tableau Dashboard Templates – Part 14 Free Tableau Dashboard Backgrounds to Instantly Elevate Your Next Project – Part 2
Table of Contents
How to Use a Tableau Dashboard Background
Getting started with a Tableau dashboard background is quick and straightforward.
Replace the placeholder sheets with your content, including logos, titles, filters, KPIS, and worksheet visuals that align with the dashboard background structure.
Customise the layout by adjusting colours, fonts, and content to match your brand identity. Maintain the original structure by aligning your new sheets’ outer and inner padding to fit the placeholders.
Following these steps enables you to build professional, on-brand dashboards using a Tableau dashboard background, saving time while ensuring design consistency.
#1 Dashboard Background – C1
This dashboard background layout provides a structured framework for displaying key performance indicators (KPIS), filters, and data visualisations in a clean, organised format. It includes distinct sections for a logo, a prominent title, a horizontal filter container, a KPI container for key metrics, and four sheet placeholders for data visualisations.
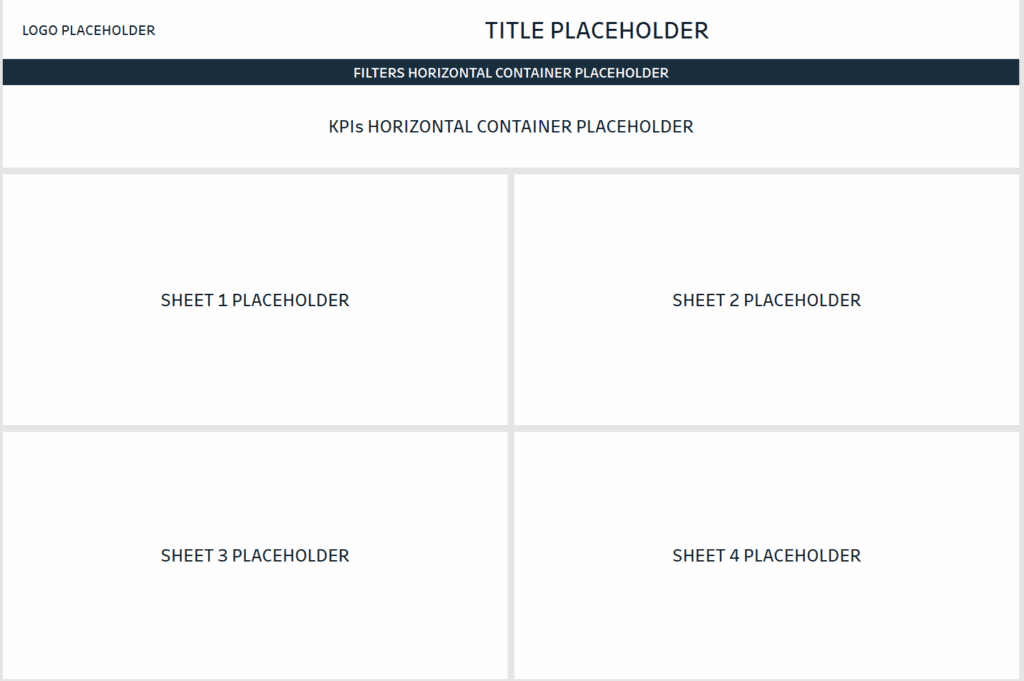
The logo placeholder at the top supports branding and visual consistency. The title section is centrally positioned for maximum visibility, followed by a dark horizontal bar for filters, allowing users to interact with data dynamically. The KPI container highlights critical metrics such as financial figures, sales targets, or operational statistics for quick insights.
The four sheet placeholders below the KPI section use a grid layout to display multiple datasets or data views simultaneously, making this dashboard background ideal for financial analysts, sales managers, and operations teams. The structured layout ensures clarity and easy navigation, enhancing user experience and facilitating data-driven decision-making.
#2 Dashboard Background – C2
This dashboard background layout is designed to showcase KPIS and data visualisations in a structured, user-friendly format. It includes a logo placeholder at the top left, maintaining brand visibility across the dashboard background. The title section is positioned centrally for easy identification, followed by a dark horizontal bar for filters, enabling dynamic data refinement.
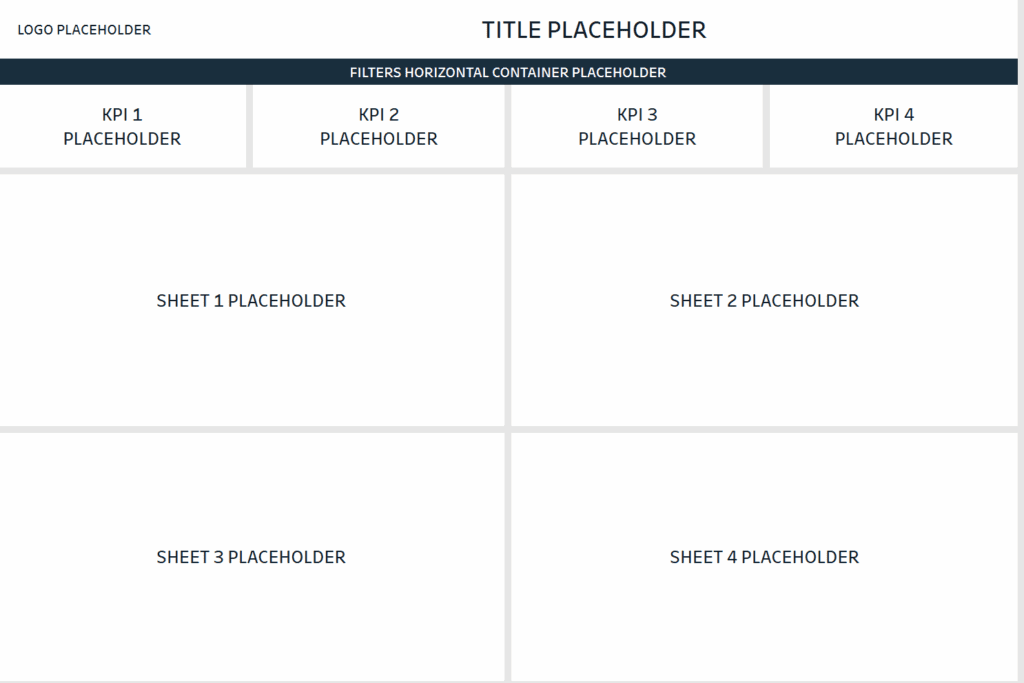
Below the filter section, four KPI placeholders highlight critical metrics such as sales figures, operational performance, or financial ratios. This structure ensures that key insights are immediately accessible, allowing users to monitor essential data points without scrolling.
The lower section features a four-sheet grid layout for data visualisations, providing ample space to present multiple datasets or analytical views. This dashboard background is ideal for financial analysts, sales managers, and operations teams who need to track various KPIS and explore specific data points.
The organised structure of this dashboard background promotes quick data interpretation, enabling decision-makers to identify trends, spot anomalies, and derive actionable insights effectively. The balanced layout ensures visual consistency while maintaining clarity across data views.
#3 Dashboard Background – C3
This dashboard background layout is structured to present key performance indicators (KPIS) and data visualisations in a clear, organised format. It features a designated logo placeholder at the top left for branding consistency and a central title section that identifies the dashboard’s purpose. Directly below the title is a horizontal filter bar, allowing users to adjust data views dynamically based on specific criteria.
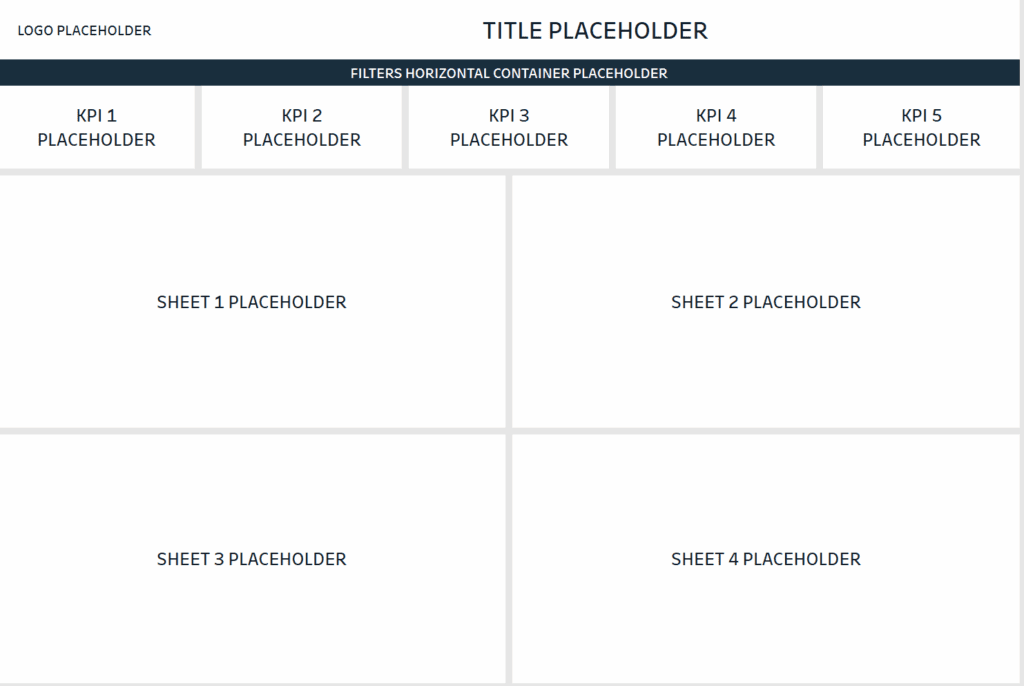
The KPI section is divided into five distinct placeholders, enabling users to showcase critical metrics such as revenue, expenses, operational performance, sales targets, or customer satisfaction scores. This setup ensures that key data points remain immediately accessible, supporting quick, data-driven decision-making.
The lower section comprises a four-sheet grid layout for data visualisations, providing ample space to display comprehensive datasets or multiple data views. This structured format makes it ideal for financial analysts, operations managers, and business intelligence teams who need to monitor various KPIS simultaneously while drilling into specific data insights.
This dashboard background benefits complex data presentations where multiple KPIS must be tracked alongside detailed data visualisations. Its balanced structure promotes clarity, ensuring that essential metrics are prominently displayed while maintaining a visually cohesive layout.
Choosing the right dashboard background can significantly influence how effectively data is communicated. The three examples showcased in this blog demonstrate how strategic design can transform raw data into clear, actionable insights. Whether you’re a data analyst, business manager, or financial consultant, implementing these dashboard backgrounds can elevate data presentations, maintain visual consistency, and drive more informed decision-making.
Supercharge Your Data Storytelling with These Ready-to-Use Tableau Dashboard Templates – Part 1 Free Tableau Dashboard Backgrounds to Instantly Elevate Your Next Project – Part 2